Tutorial:
As many parts of the United States begin to lift shelter-in-place, it’s crucial for us to be able to estimate the risks involved with resuming non-essential activities, particularly those involving large crowds. The COVID-19 Risk Assessment Planning tool can be used to explore the risk that at least one person at an event of a certain size is currently infected with COVID-19, given a certain number of circulating infections in the specified region.
Our risk calculations tell you only how likely it is that at least one person at any event of a given size is infectious. This is not the same as the risk of any person being exposed or infected with COVID-19 at the event
We define circulating cases (people who are currently infectious) as cases reported in the past ten days. Note that real-time risk assessments prior to August 14th used a fourteen day window. The choice of a reduced duration is consistent with CDC advice on the duration of typical infectous periods (though we recognize that individuals may shed longer). We correct for under-reporting by multiplying by an ascertainment bias. Based on seroprevalence data, we suspect that in many parts of the US this is around 10:1 (i.e., ten total cases for every one reported), but this rate may vary by location, and we also include a 5:1 ratio on the main page. Cases may be under-reported due to testing shortages, asymptomatic “silent spreaders,” and reporting lags.
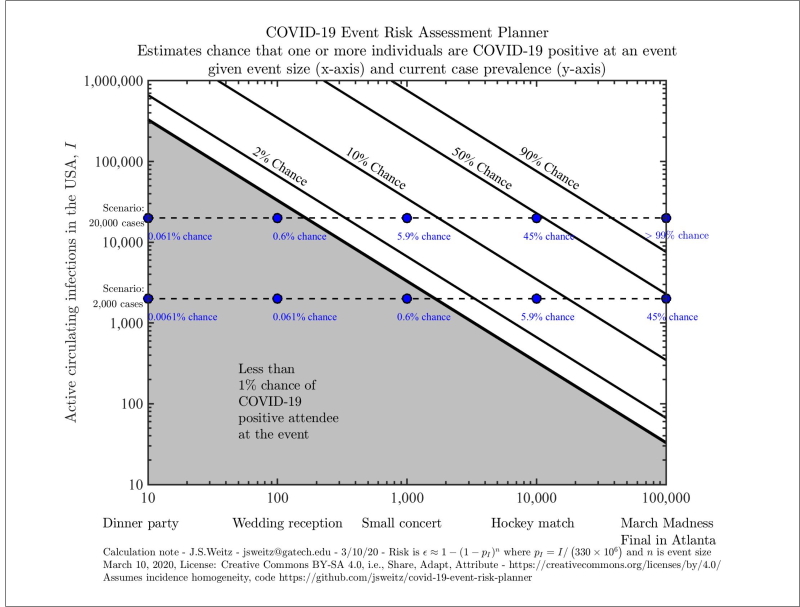
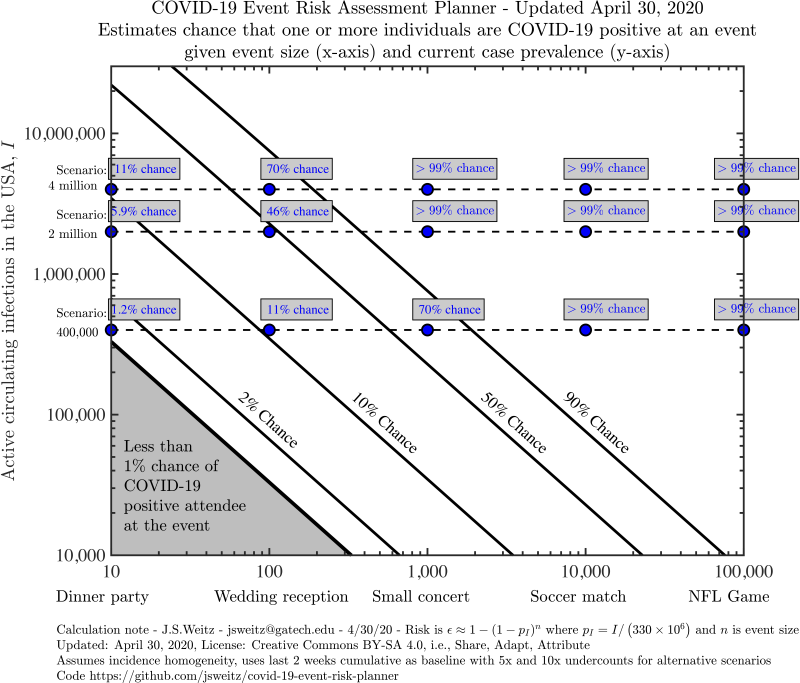
Our tool generates figures that look like this.

Please note that our axes are given on a logarithmic scale, so moving up by one tick means multiplying that variable by ten. The diagonal lines divide the chart into risk levels. For example, all scenarios between the orange and red lines involve a 10-50% risk that someone with COVID-19 is present. The grey region indicates scenarios with a less than 1% chance that someone with COVID-19 is present. We give you exact values for a few preset scenarios in the blue boxes. In this example, we also see a 48.7% chance (red dot ⬤) that someone has COVID-19 at an event with 275 attendees if 800,000 cases are circulating in the US.
You can get exact values for your own scenario using the Explore US and State-level estimates tab. You can generate a risk assessment planner for the entire country or focus on a particular state (this will just change our estimate of the total population size and the proportion of people who are infected).
When you input the number of circulating cases, it’s important that you include only those that are currently infectious. This is different from the total number of cases reported because people infected several weeks ago are likely no longer contagious. It’s also likely that we’re only detecting a fraction of cases due to testing shortages, reporting lags, and asymptomatic “silent spreaders.” A rough calculation you can do is to take the past week or two of reported cases and potentially multiply it by some constant (for example, five or ten) to correct for the virus’ ongoing spread and the proportion of cases you think may be undetected.
Otherwise, we’ve done that calculation for you in the Real Time US and State-level estimates tab. The horizontal dotted lines with risk estimates are based on real-time COVID19 surveillance data. They represent, estimates given the current reported incidence (circle ⬤), 5 times the current incidence (triangle ▲), and 10 times the current incidence (square ◼).
Notes on Usage and Interpretation:
Please feel free to share any plots that you generate (we’ve provided a Download button). We’d love for you to use this as a tool to educate your community and weigh the risks of holding certain events right now. You can see how this tool is already being used in the Press tab.
Here’s a sample tweet to accompany the graphic:
Today's #COVIDRisk in GA: if 275 people are at a indoor music venue, there's a **X%** chance someone has #COVID19. Learn more at https://covid19risk.biosci.gatech.edu
All of our calculations are necessarily estimates, based on imperfect data. We can’t tell you the probability that someone in the event will get infected. It’s important to remember that a certain amount of chance is involved in these outcomes. We’d encourage large event planners to exercise caution in the coming months, especially given the potential for one infected person to transmit the virus to many others in one super-spreading event (Biogen conference, Atalanta-Valencia soccer match, Washington choir practice).
As a final note, there is a moderate to high risk of being exposed to COVID-19 in many parts of the US right now. You can reduce your risk of getting infected or infecting someone else by practicing social distancing, wearing masks when out of your home, hand-washing, and staying home when you feel sick. Learn more on how to minimize your individual risk at https://www.cdc.gov/coronavirus/2019-ncov/prevent-getting-sick/prevention.html.
How we do our calculation:
What is the chance that one person at this event will already be infected with COVID-19? To answer this kind of question, we actually calculate the opposite. For example, if we were talking about a NFL game, we’d ask what is the chance that none of the 75,000 attendees is infected?
Let’s start by thinking about just one of them. If 20,000 of the 330 million people in the United States are sick, then each person has a 99.994% chance of being disease-free. In betting terms, the odds are 16,500:1 in our favor. While that sounds good from an individual perspective, the collective risk is very different.
In this scenario, the probability that all 75,000 attendees would have entered the stadium disease-free is like placing 75,000 bets each at nearly certain odds. Sure, you’ll win most of the bets. But the probability that you will win every single one of those bets is extremely low. To calculate it, we multiply the winning probability (1-1/16500) by itself 75,000 times and find that there is approximately a 1% chance that we win every time. In other words, the chances that one or more attendees would have arrived infected with SARS-CoV-2 is 99%.


